The All-in-One Growth Command Center For Scaling eCommerce Businesses
Abundify isn’t just another analytics tool — it’s your essential growth engine. Unlock precision attribution, cross-channel intelligence, and full-lifecycle insights — all in one powerful platform, built to scale.
.png)


Whether you’re scaling your own DTC brand, running ad campaigns for clients, or leading a high-performance marketing team — Abundify gives you the power, clarity, and precision to outperform.

Track every campaign, creative, and customer
journey from click to conversion —
all in one place

Teams
Centralize your data. Eliminate guesswork. Optimize every channel with razor-sharp attribution and full-funnel visibility.

Manage all your client accounts in one place.
Streamline reporting, prove ROI faster, and scale performance with confidence.

TikTok & More
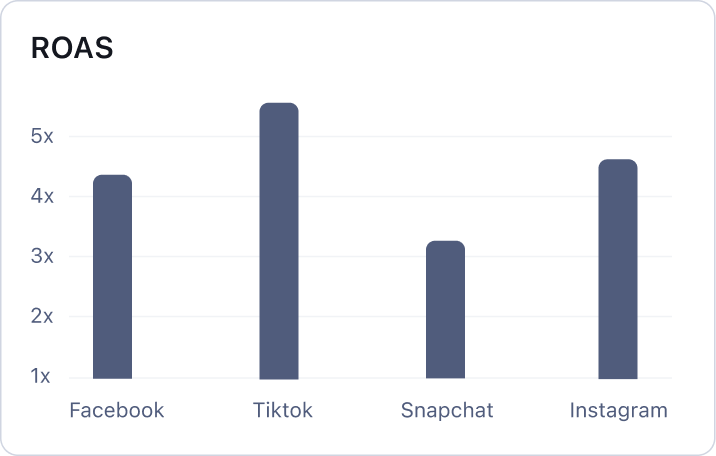
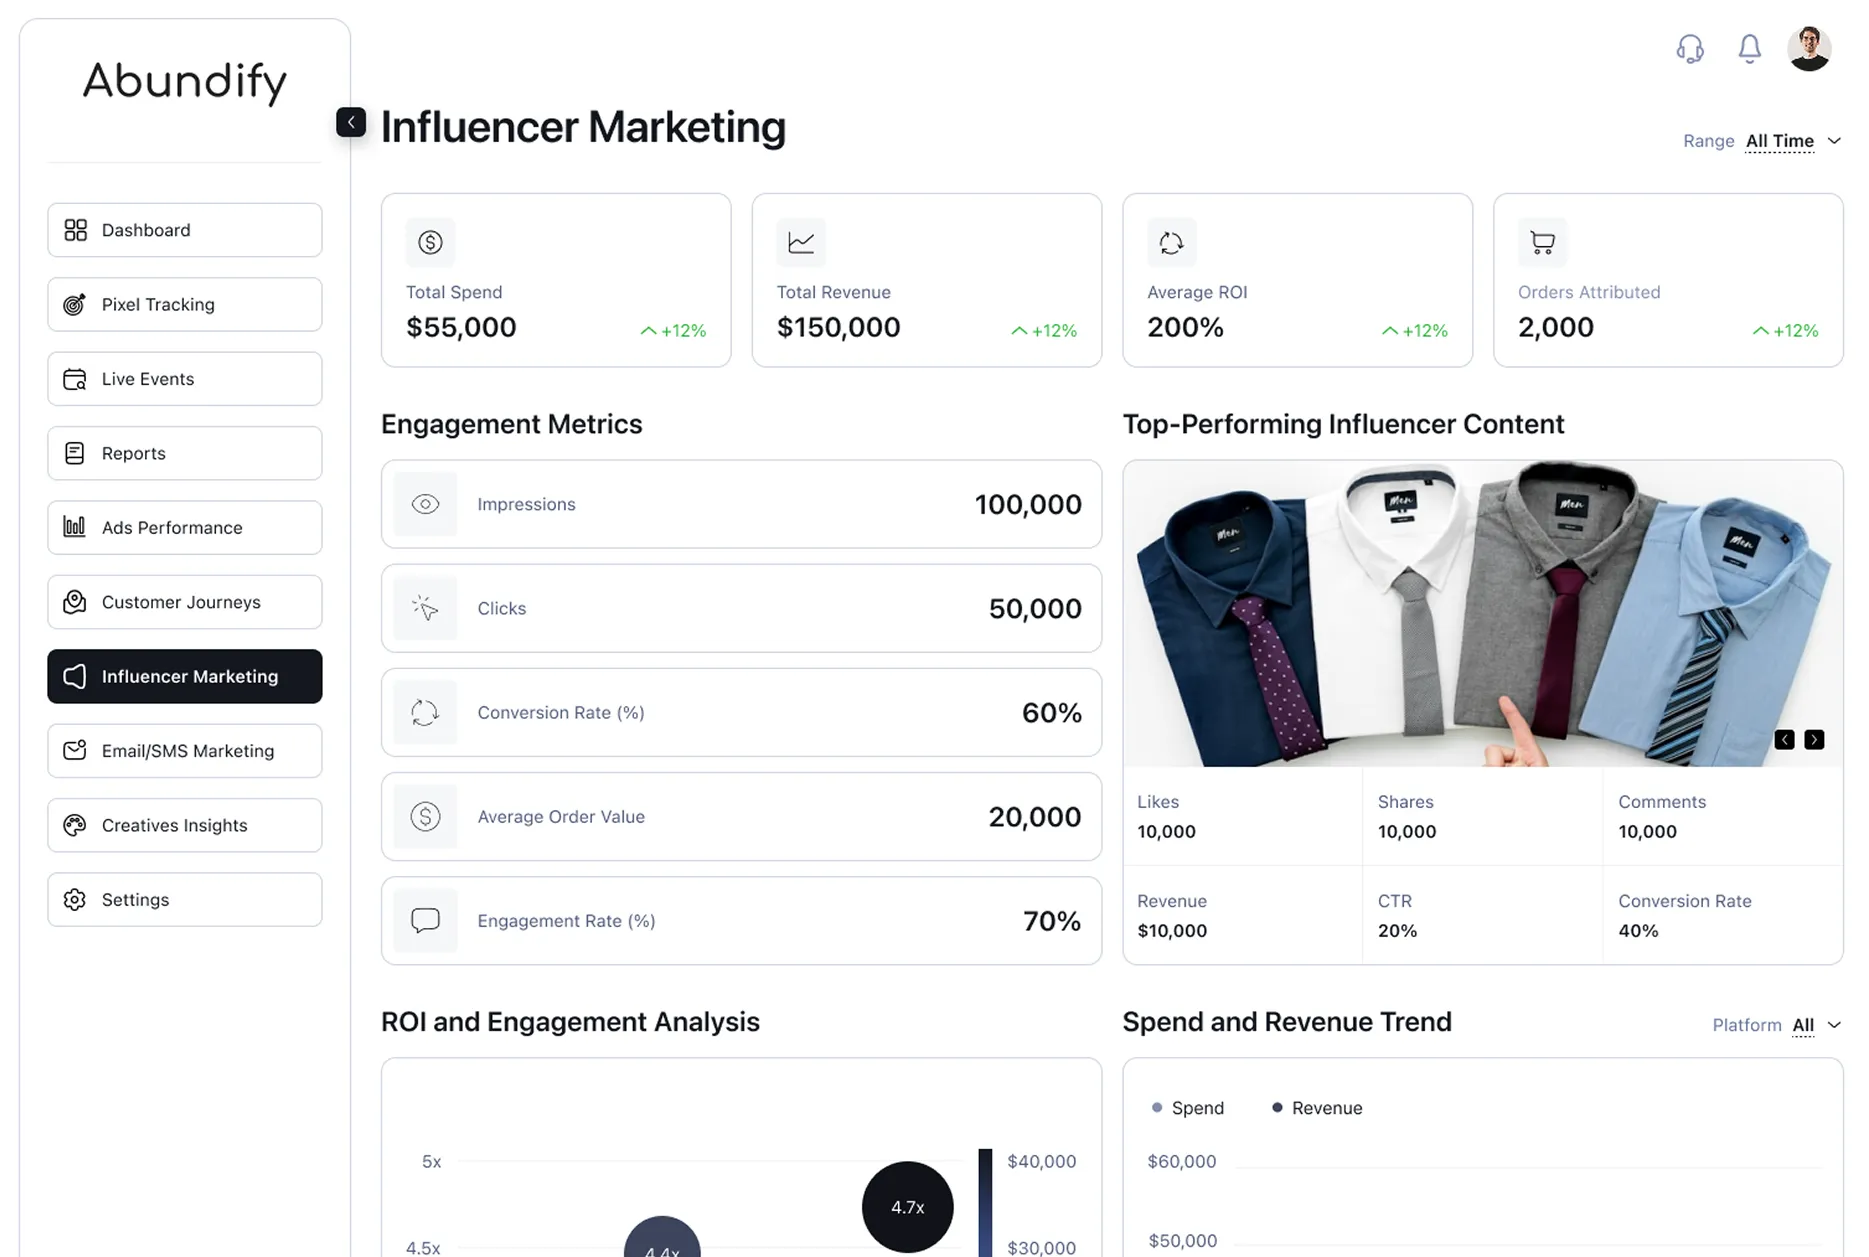
Understand exactly what works (and what doesn’t) across Meta, Google, TikTok, Snapchat and more — tied directly to your sales data.
via creative
optimization
month
Saved by killing
poor-performing campaigns
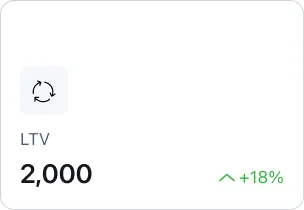
LTV
visibility using
cohort analysis
Abundify delivers unmatched insight, clarity, and control — trusted by eCommerce brands to scale with precision.

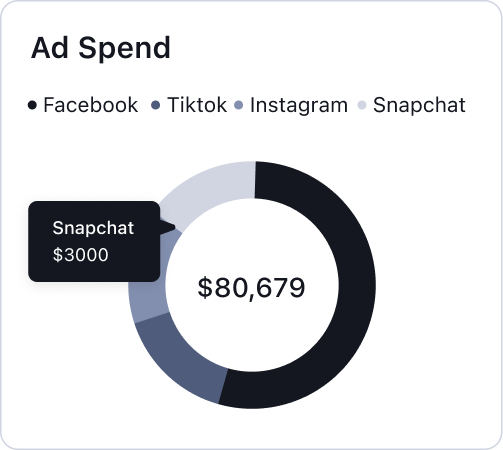

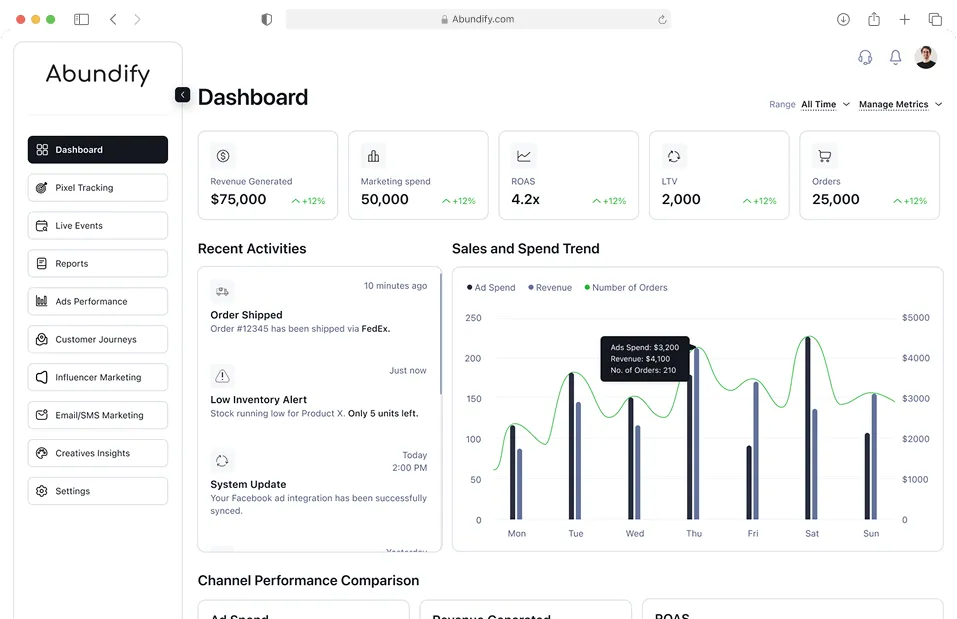
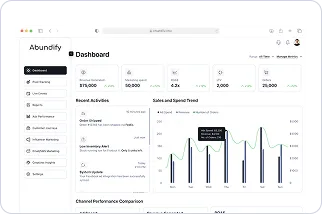
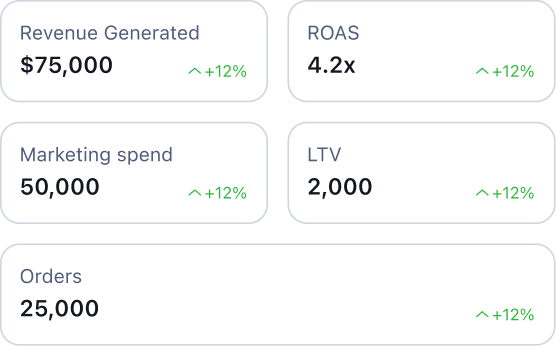
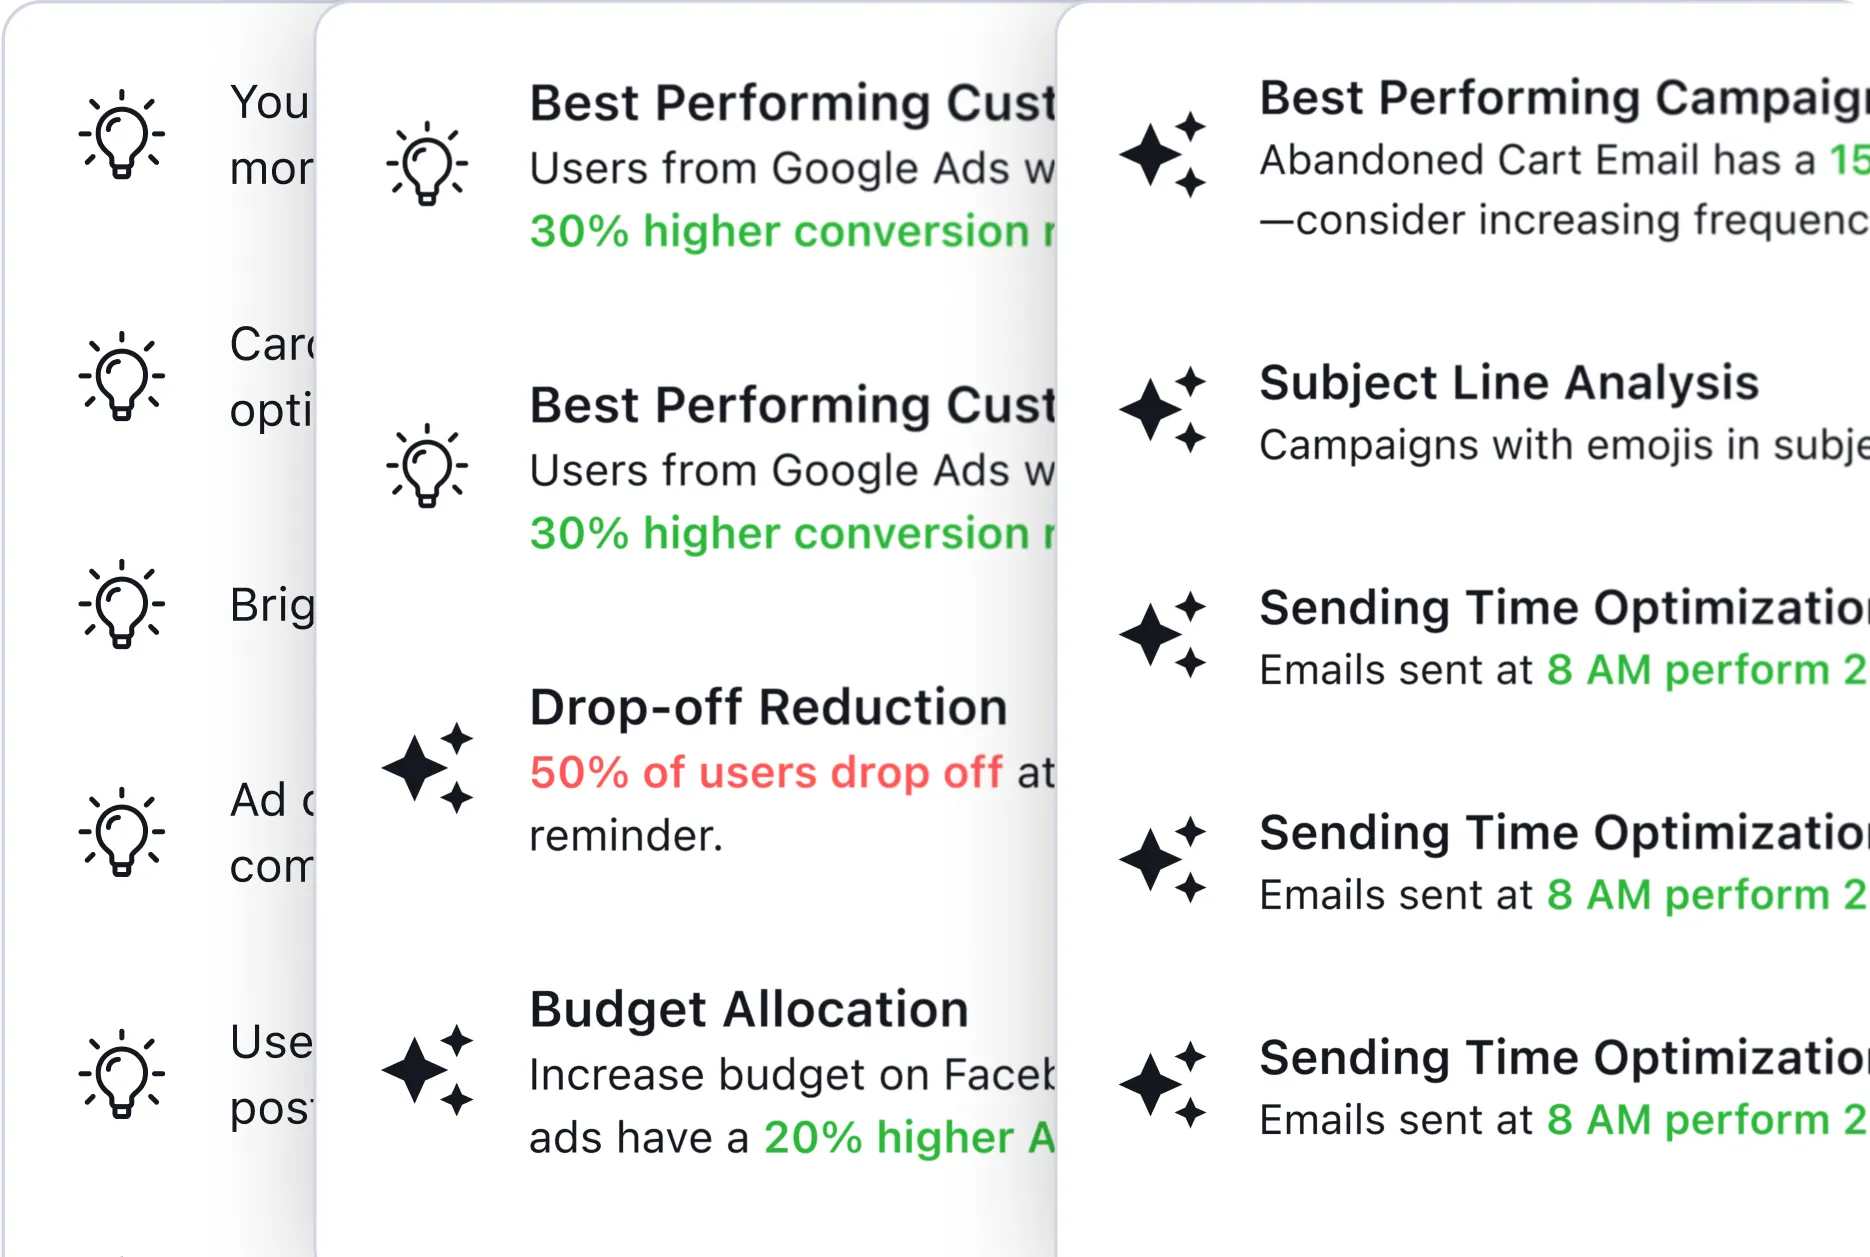
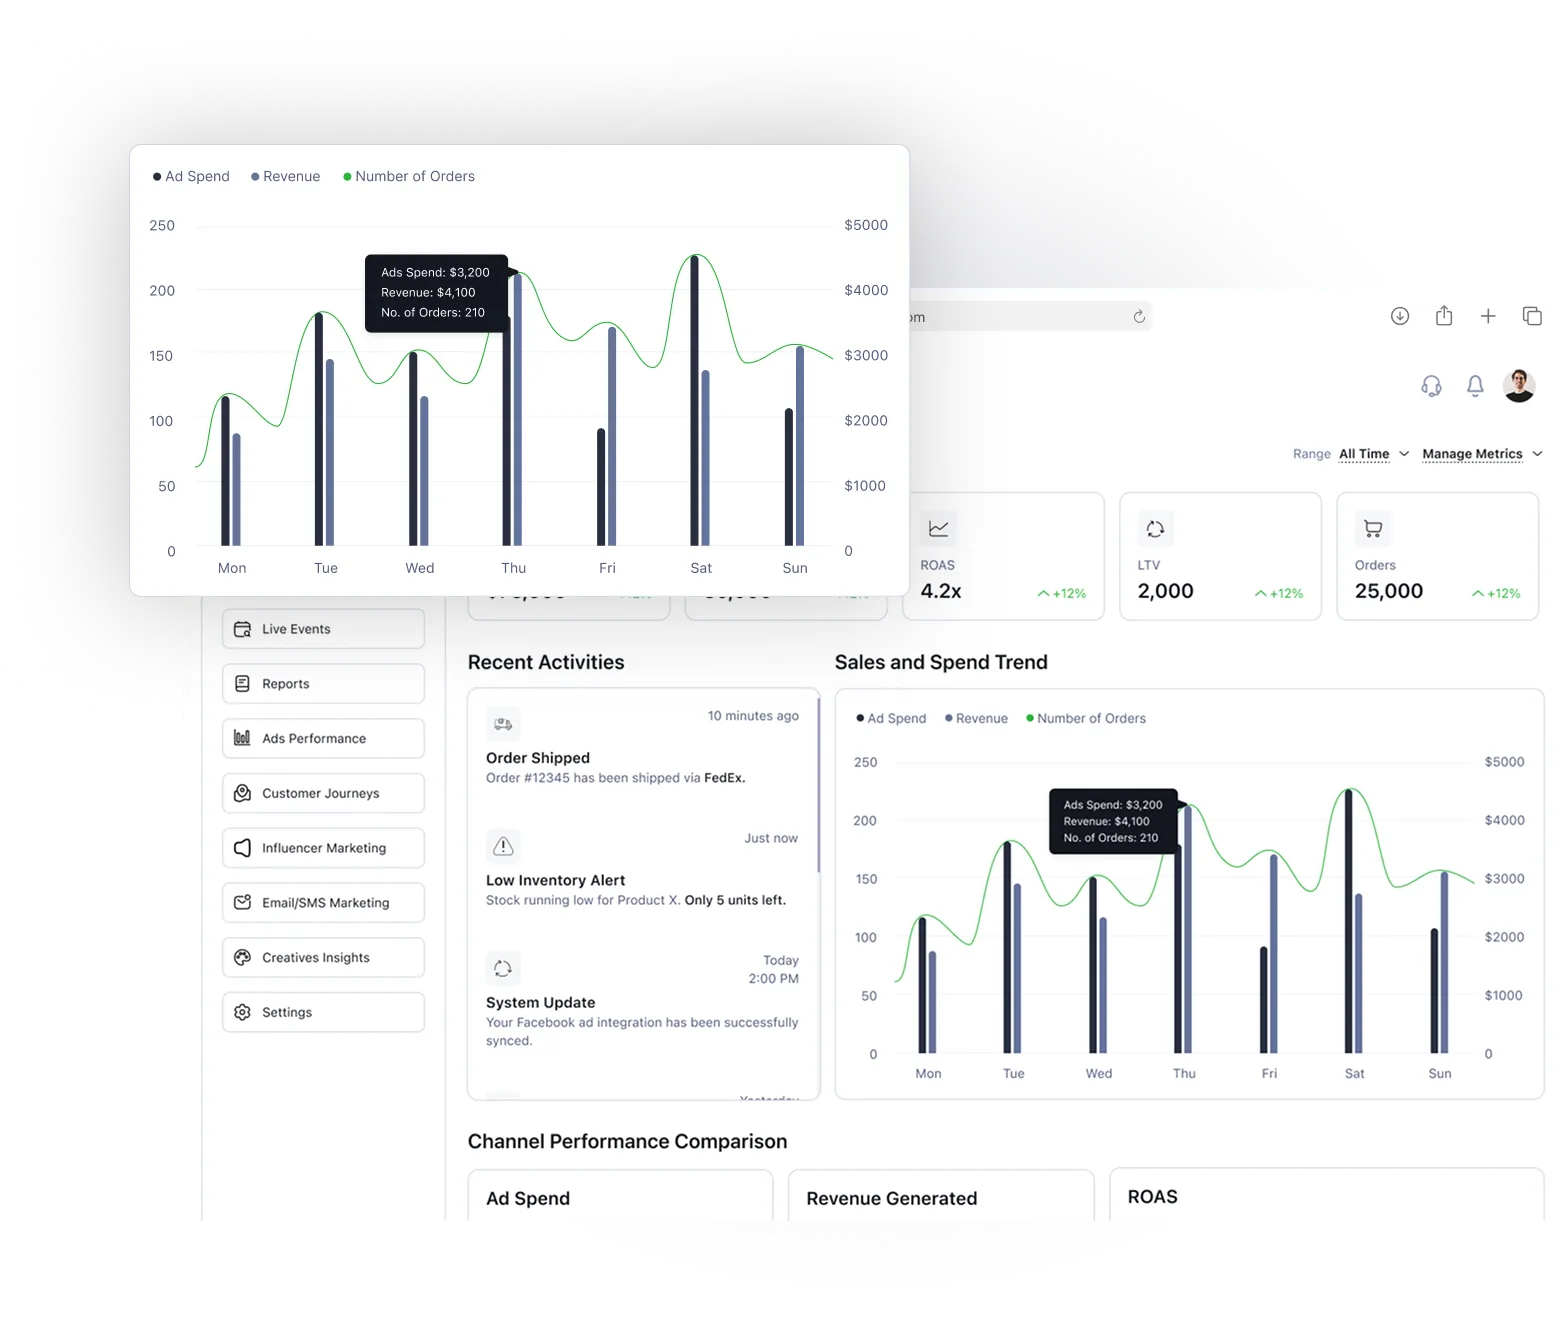
Abundify turns raw data into razor-sharp insights.
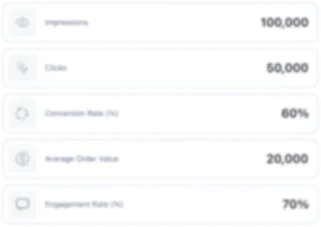
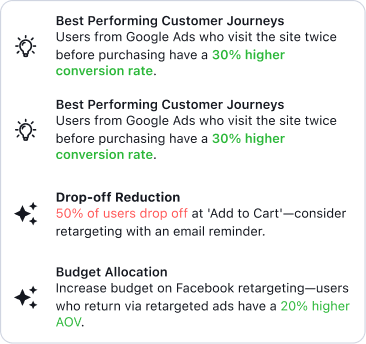
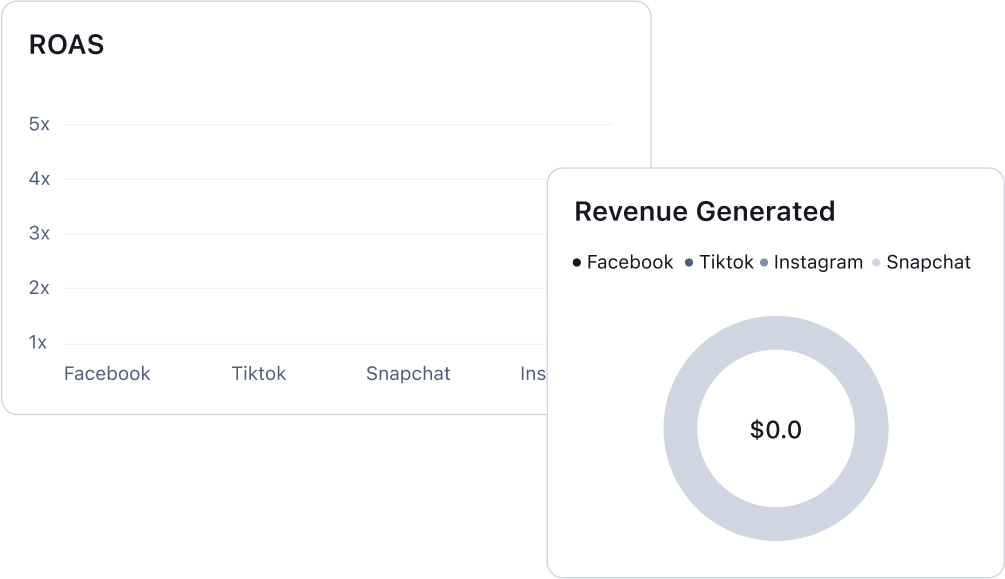
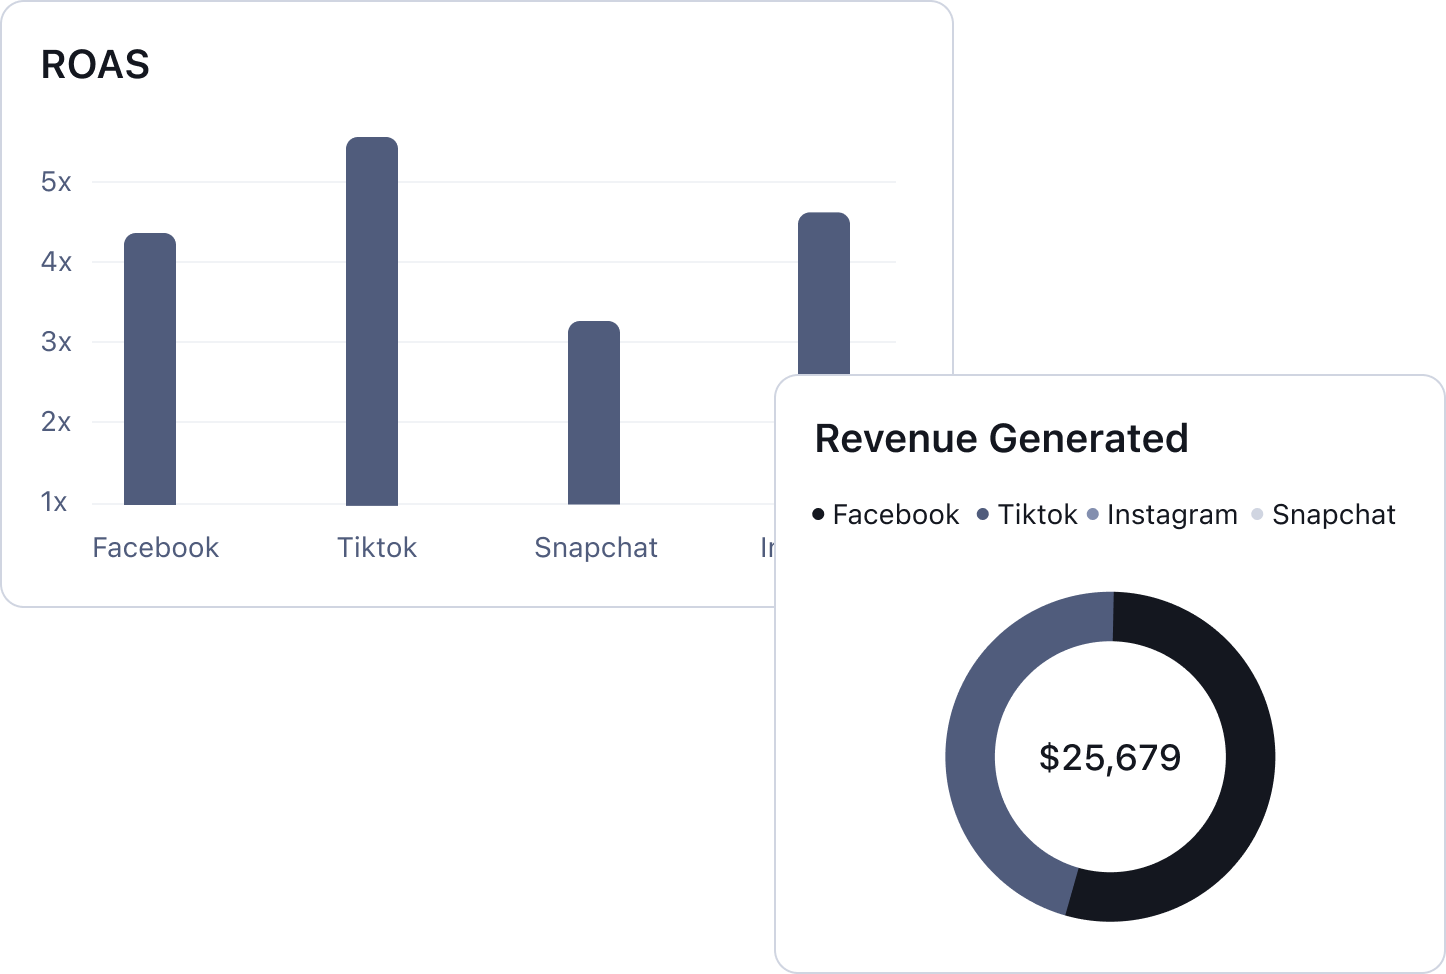
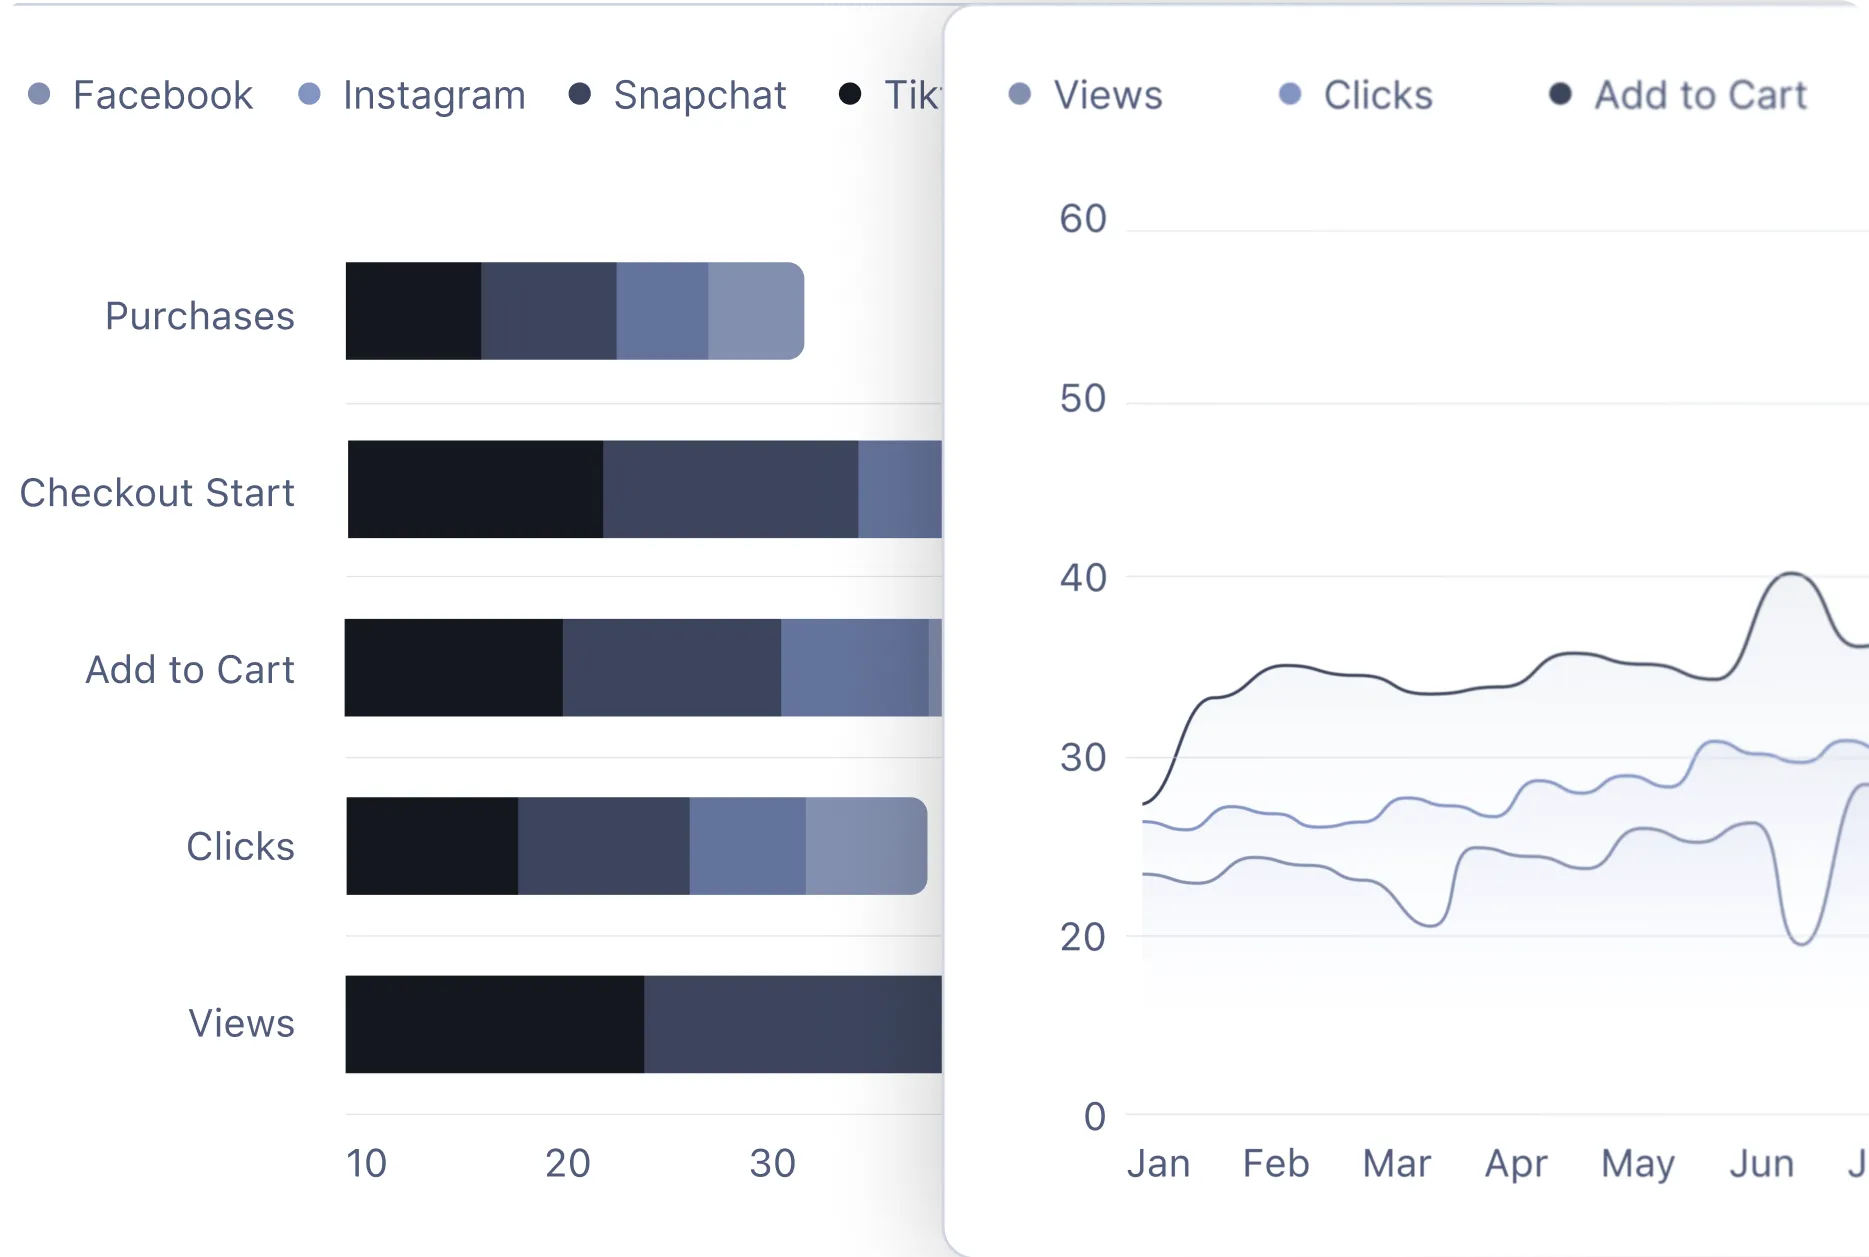
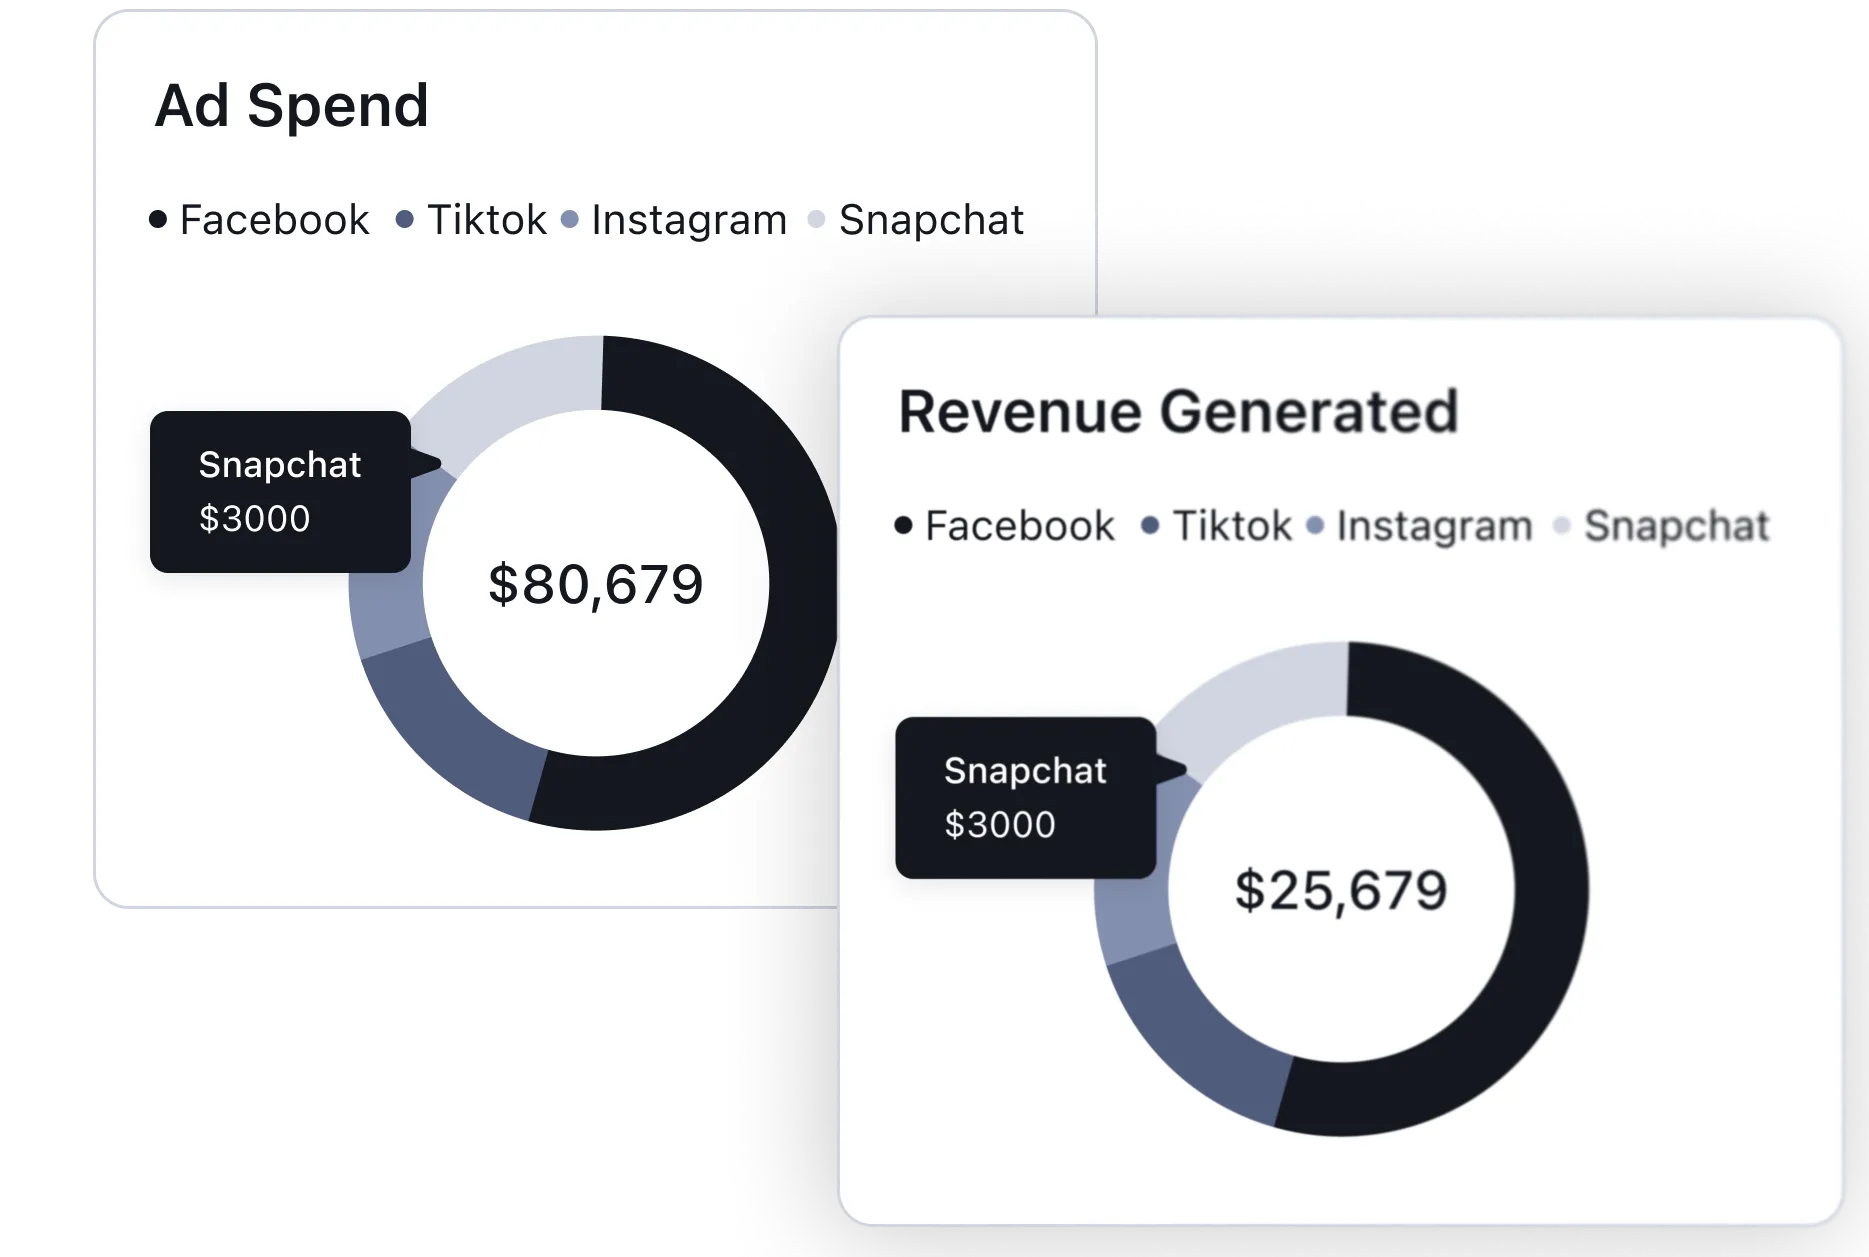
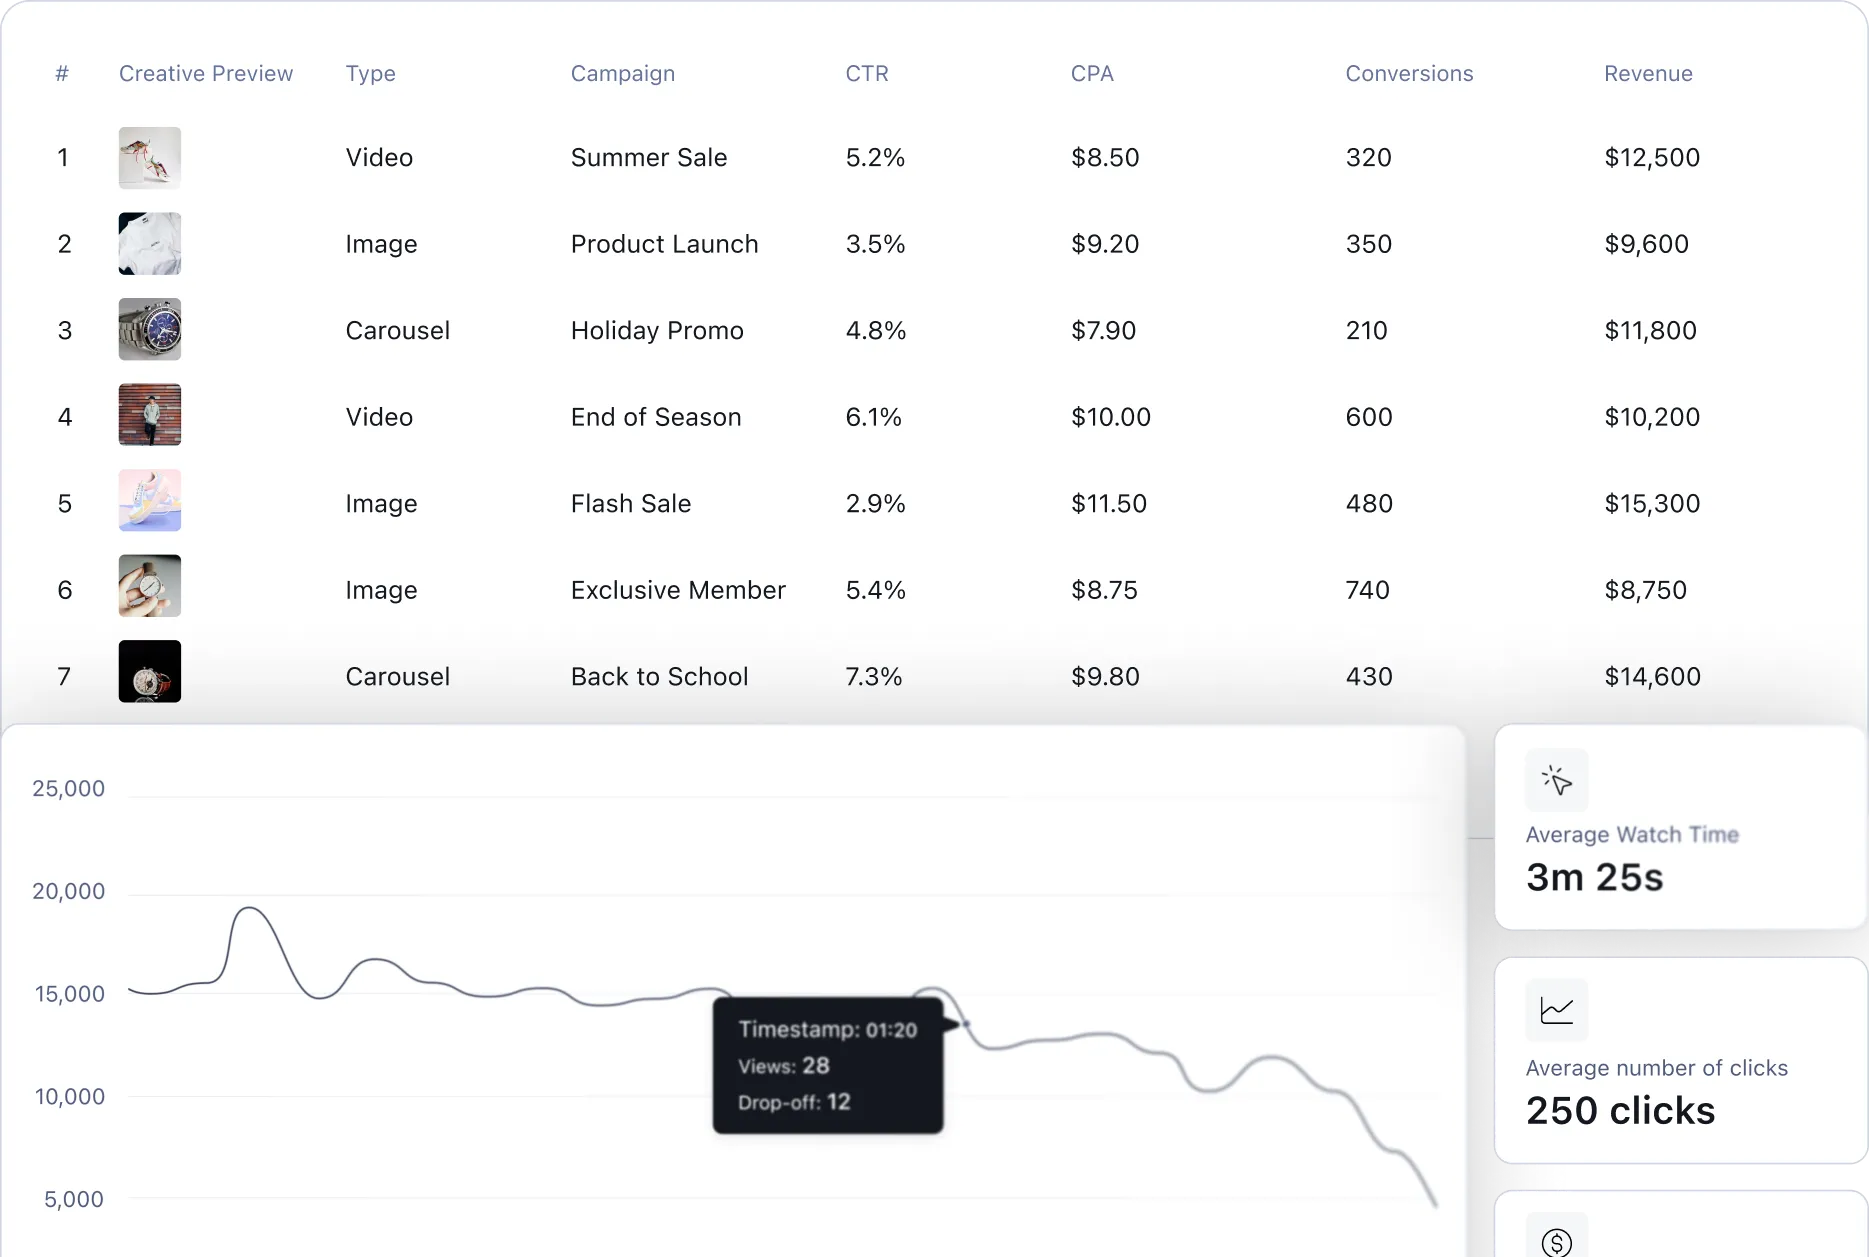
Break through the noise. Our dashboards distill complex metrics — like profit/loss, ROAS, LTV, ad spend, and conversion flow — into intuitive, interactive visuals that empower faster, smarter decisions.
Whether you’re scaling a DTC brand, managing clients, or leading a performance team, your most important numbers are never more than one glance away.

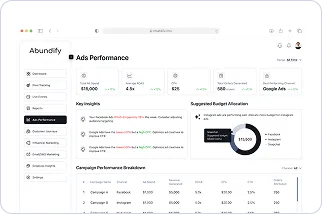
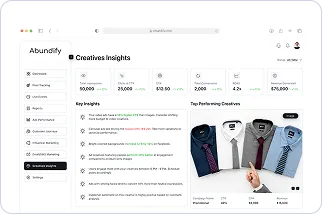
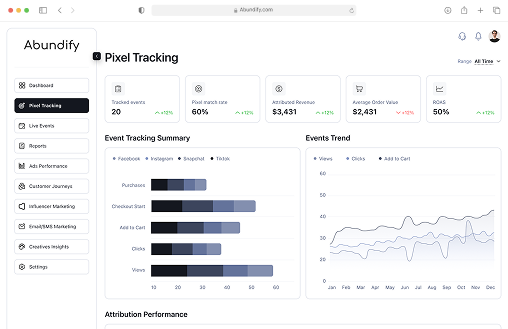
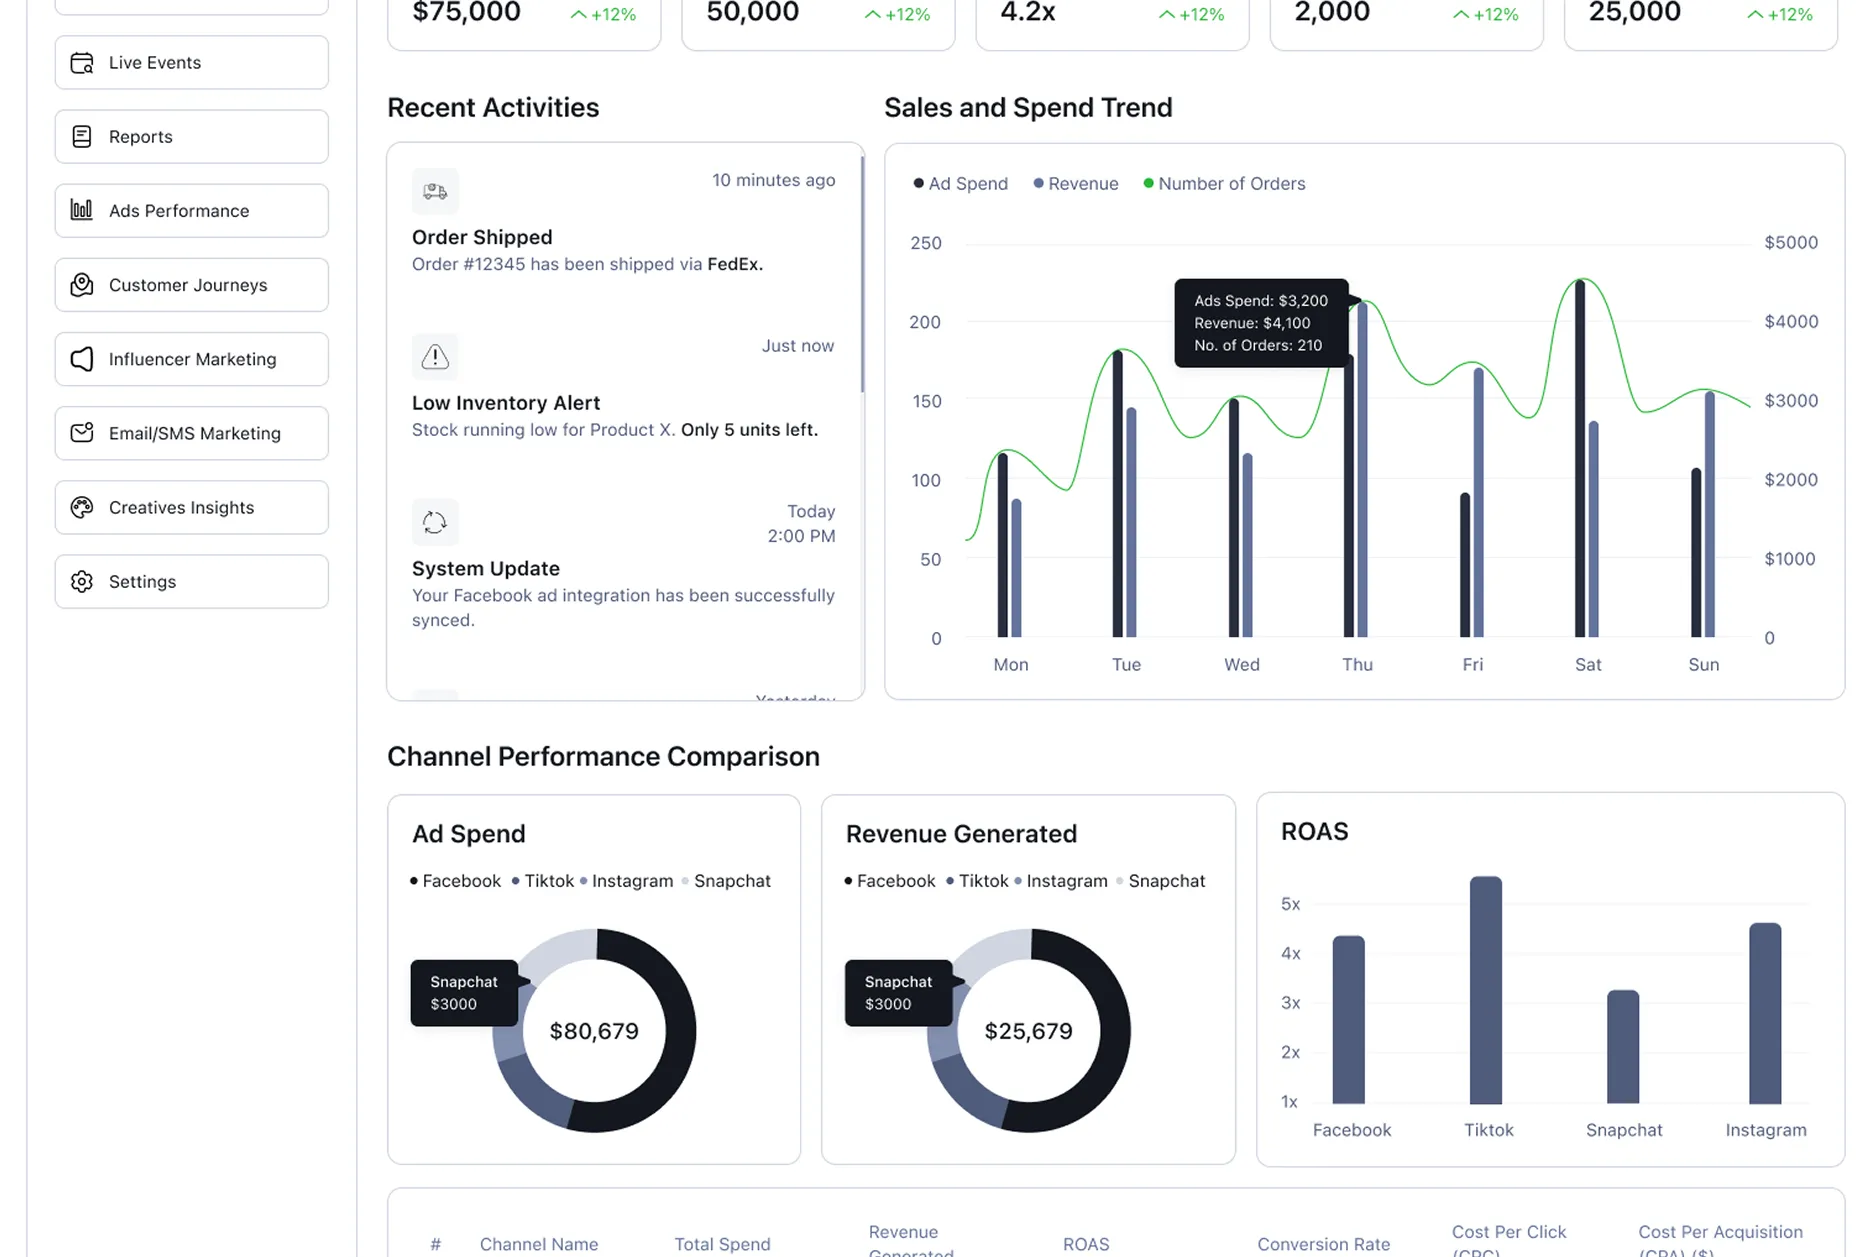
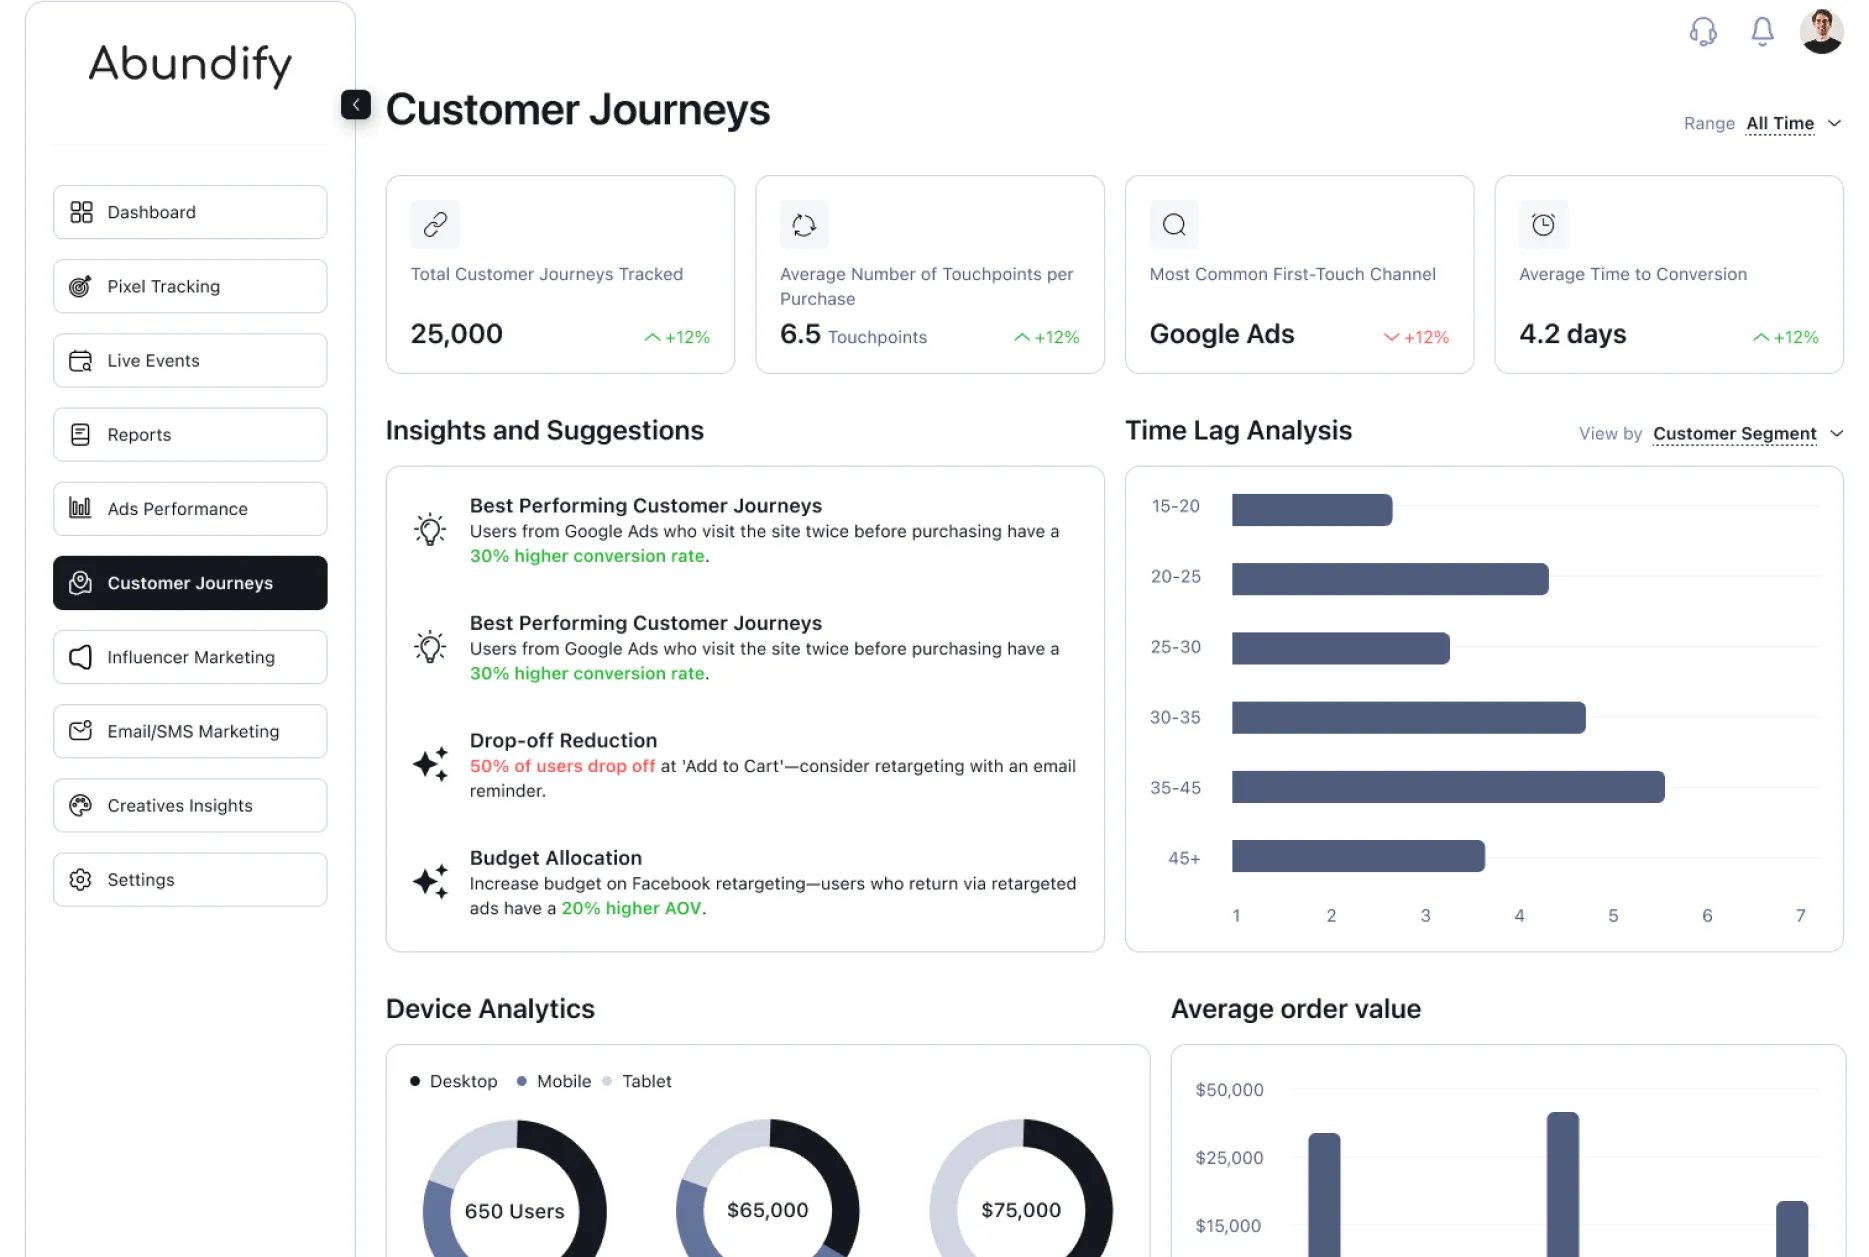
Abundify’s interface is built to feel natural — no learning curve, no clutter. Just a clean, intuitive workspace designed to help you take action, not just analyze. From pixel tracking to ad performance and creative reports, every element is built for speed, clarity, and control.
.png)
.png)
.png)

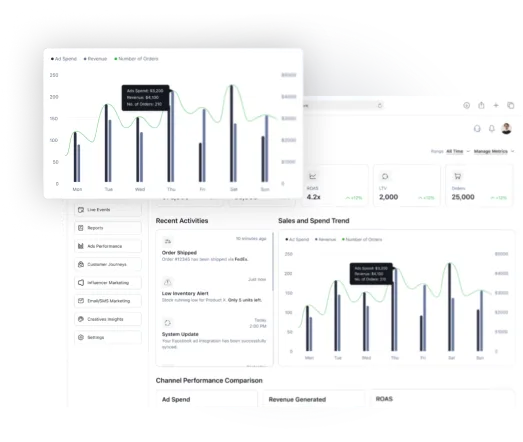
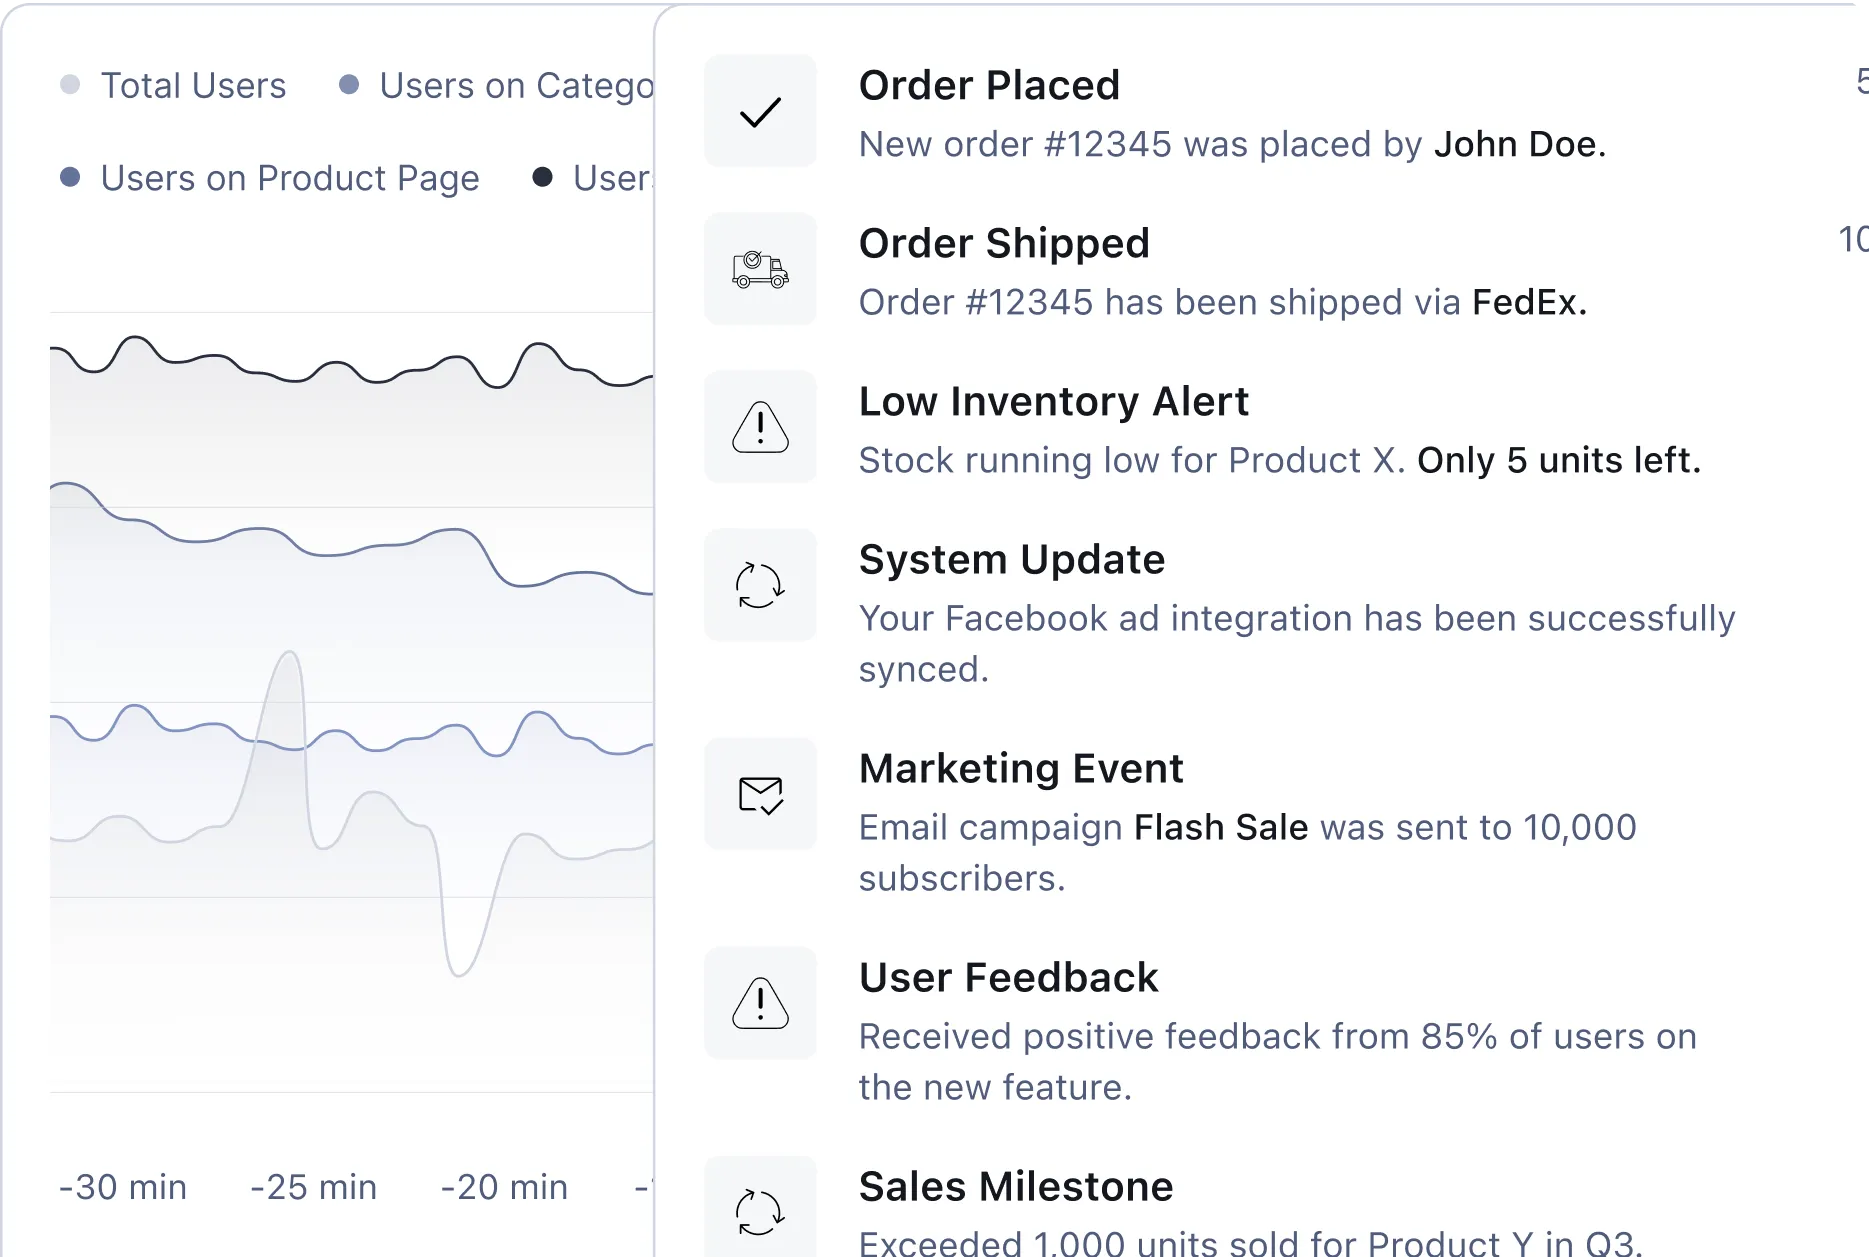
Real-time data. Anytime, anywhere. Abundify’s fully responsive design works flawlessly across desktop, tablet, and mobile — giving you full performance visibility on the go. And with our mobile app launching soon, you’ll unlock real-time insights in your pocket, whenever and wherever you need them.

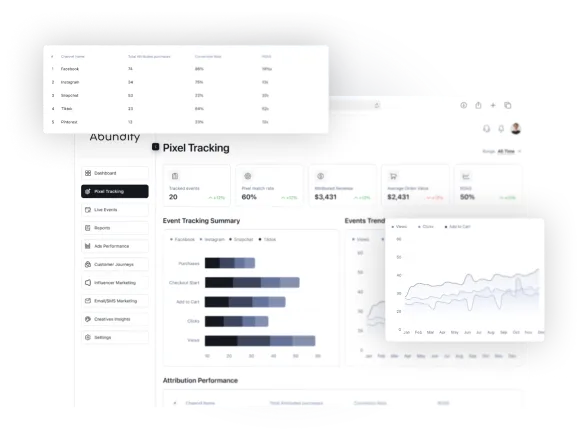
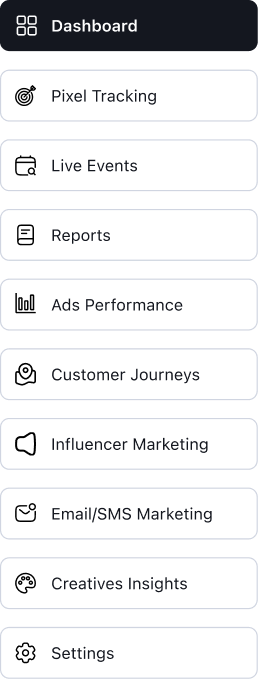
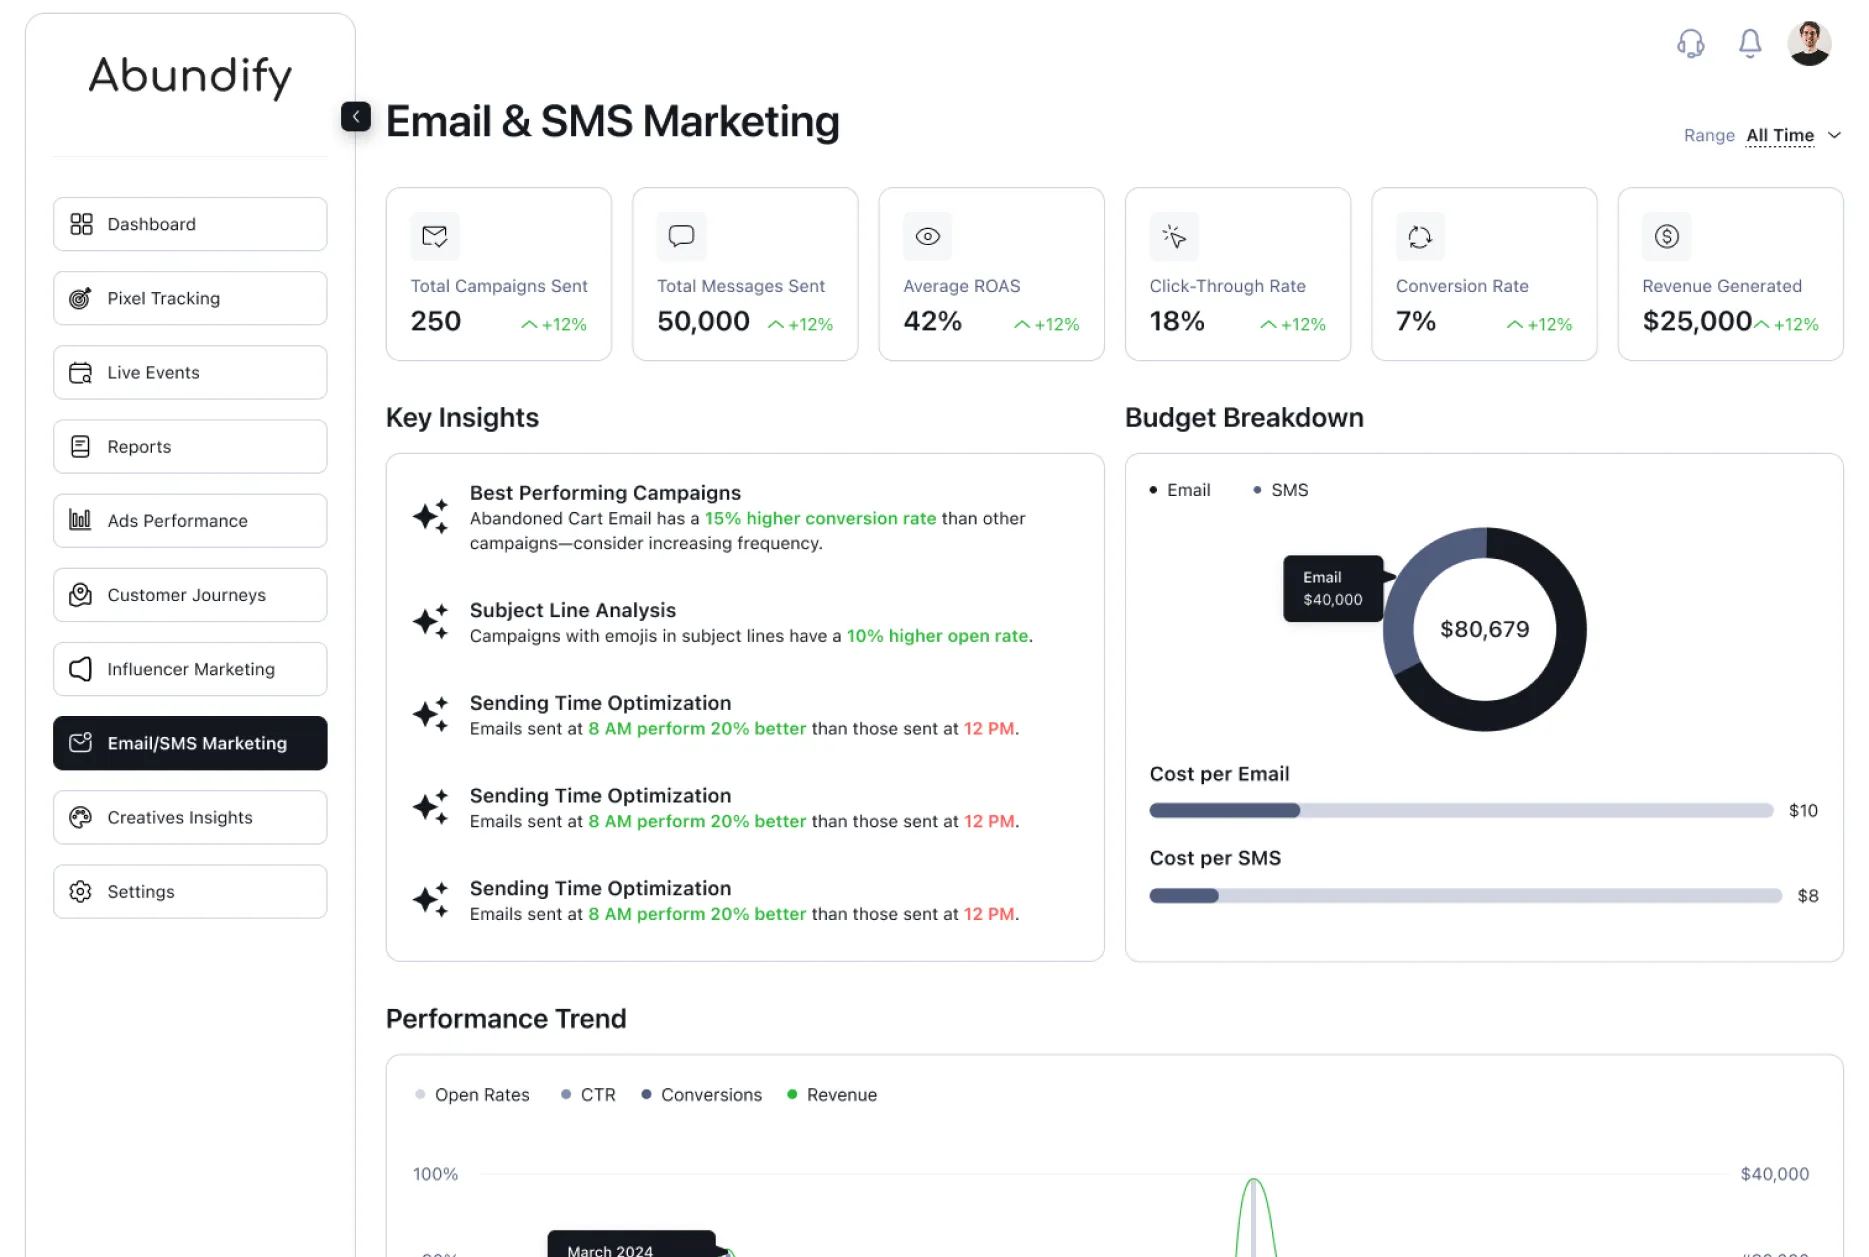
Abundify unifies your most critical marketing data — from pixel tracking and ad performance to email analytics and influencer ROI — all in one clean, intelligent interface. No clutter. Just clarity, control, and the tools to scale.
Our platform is more than just another analytics tool. We’re building a revolutionary SaaS experience for modern eCommerce businesses that care about performance, clarity, and growth. Here’s how we stand out:
one place:


TikTok, Klaviyo, Attentive, Postscript, etc

TikTok, Klaviyo, Attentive, Postscript, etc

TikTok, Klaviyo, Attentive, Postscript, etc
attribution, funnels, LTV, influencer ROI, and more
TikTok, Klaviyo, Attentive, Postscript, etc
attribution, funnels, LTV, influencer ROI, and more
or optimize creatives — all with data-backed insights.

We integrate directly with Shopify, Meta Ads (Facebook/Instagram), Google Ads, TikTok, Klaviyo, Postscript, Attentive, and more. You can connect your full marketing stack in just a few clicks.
Our pixel tracking uses server-side and client-side methods to maximize accuracy, with match rates validated against your Shopify order data. We also visualize attribution overlaps between platforms to give you the full picture.
Yes! Our platform is built for scale — you can manage multiple stores or clients under one account with dedicated dashboards, reporting, and permissions for each.
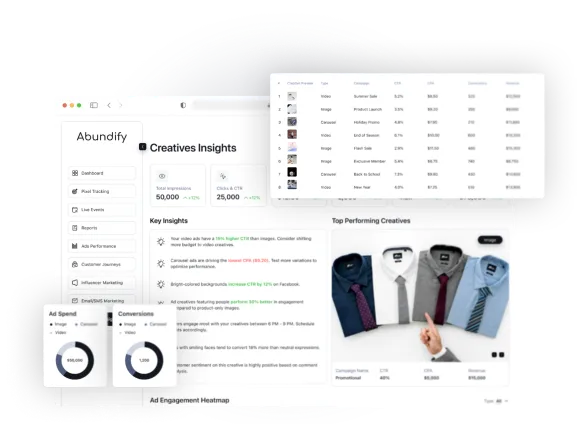
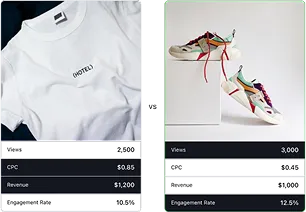
Absolutely. Track influencer ROI, view content previews, monitor product-level performance, and compare across multiple creators to see who truly drives revenue
Use our custom report builder to generate reports based on KPIs that matter most to you. Or choose from pre-designed templates like “Weekly Performance.” Export in PDF, Excel, or CSV.
Yes. We follow best practices in data security and are fully GDPR-compliant. Your data is encrypted, and access is limited to only what’s required
Yes — you can start with a 7-day free trial and explore the full platform without limitations.